Dataset in Data Frame
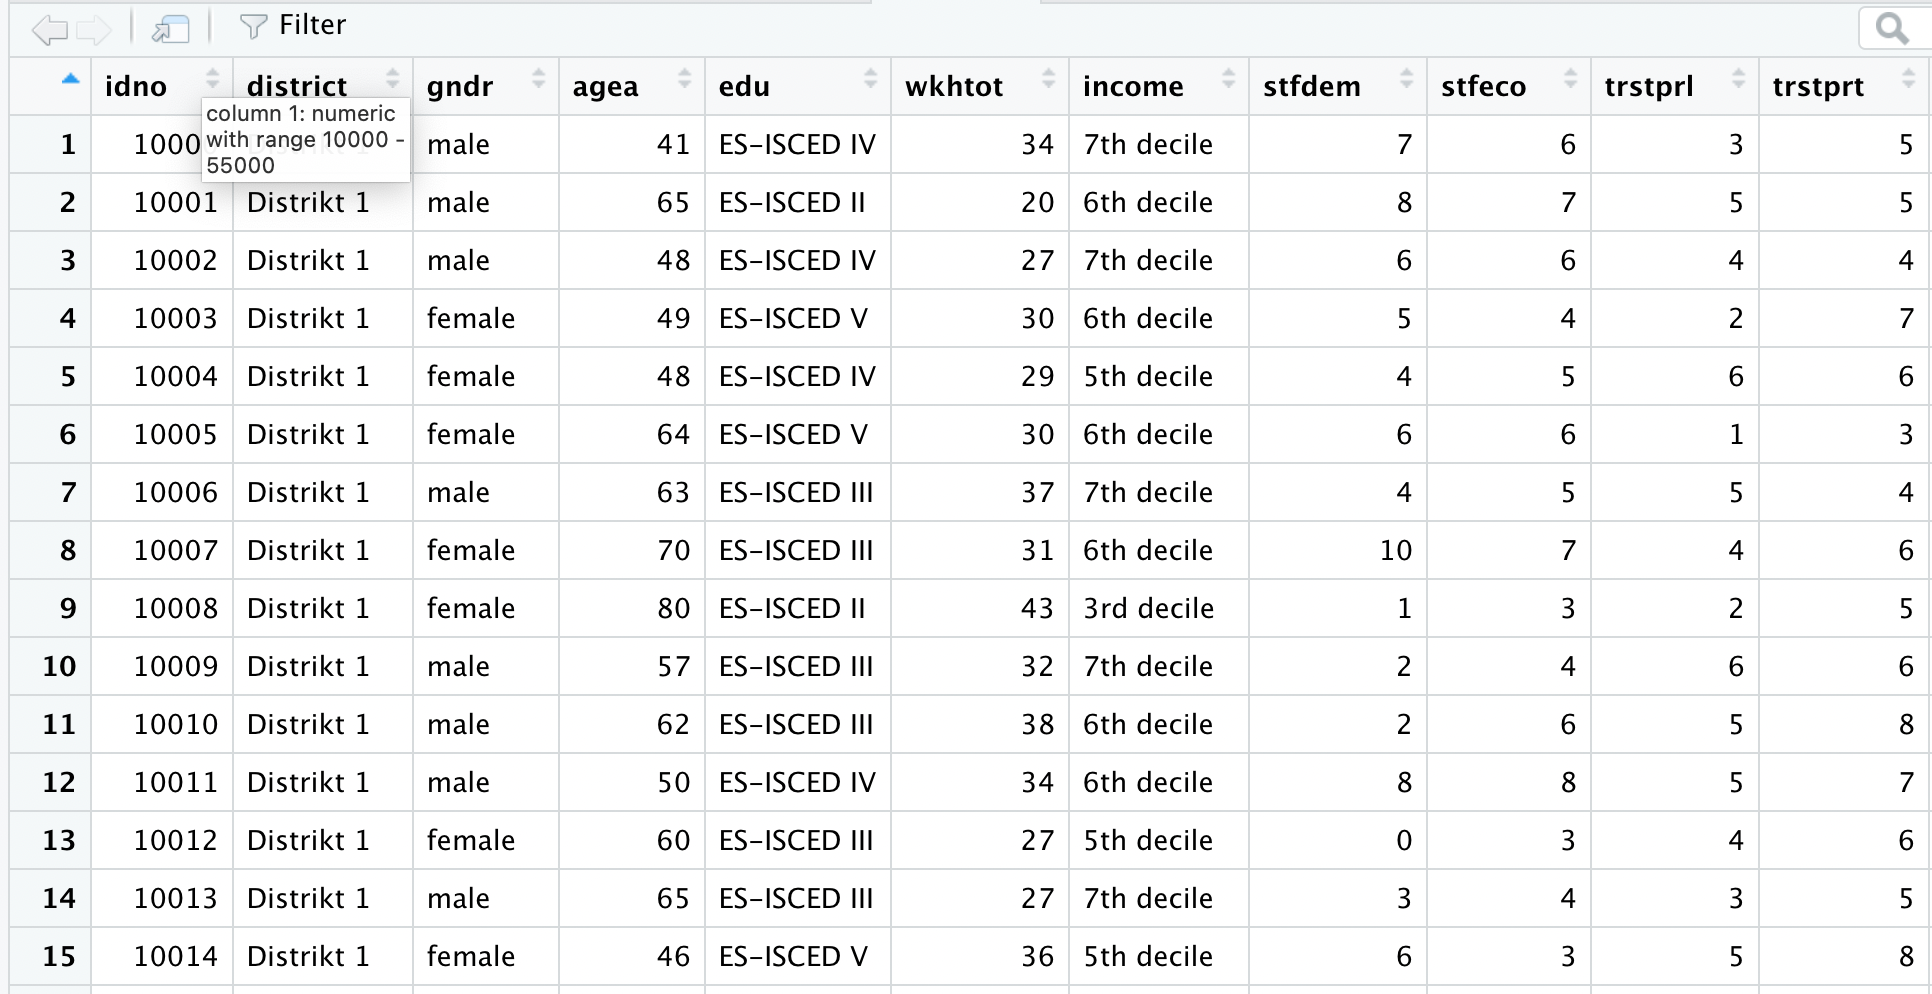
Now you will learn about the structure of a data table. In the screenshot, you can see the dataset of PSS limited to the four sample questions (variables) from the previous page.
If you take a closer look at the variable stfdem now, you will see that only numerical values are entered there. Even for the code values 0 and 10, the value labels from the PDF are not used, but the code value! This is an important insight. Because only when numerical values are used for all variations, the variable can be used as a metric scale level and stored in a numeric or integer vector. Because: All statistical calculations require numeric or integer vectors, as standard deviation cannot be calculated with letters.
You have now understood how a data table is structured, what is contained in the rows, columns, and cells. In R, these data tables are stored as objects of type data frame.
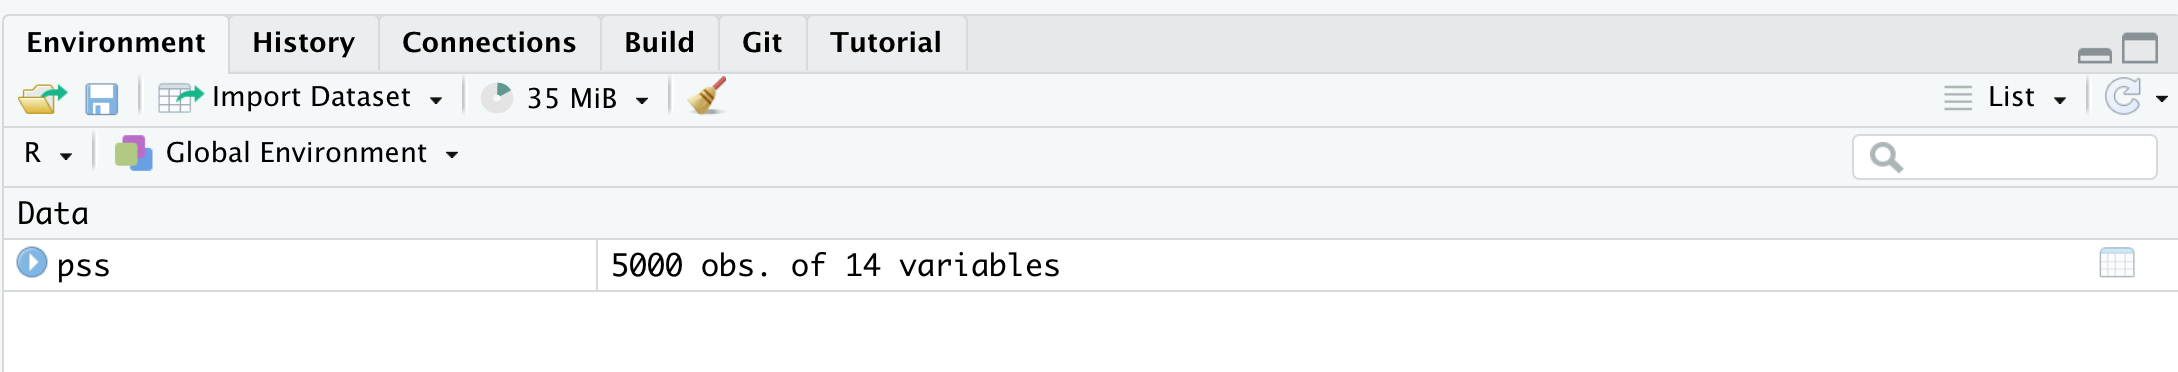
In the Environment, you can see that this falls under the group data. You also see that the object is expandable. If you click the arrow button, all variables (each with a $ in front) that are summarized in this new object will appear. It is easy to understand that a data frame is simply the summary of all variables (or vectors in R) of a survey.
You can open the data view with a double-click. This is simply the data table as discussed above. The variables are in the columns and the cases are in the rows (except the first row!).
But how do you handle a dataset in R?