Coding Challenge
We have already taken the first steps in connecting individual values to vectors (variables), and we will review this here and introduce a few additional steps. Sometimes data is collected independently, and we are now creating a dataset from the collected data. With the following steps, you will deepen your understanding of the data frame object.
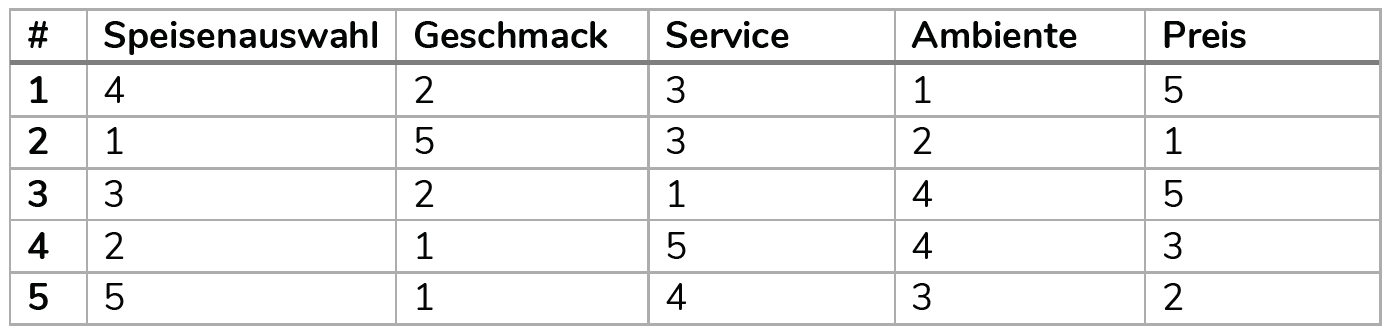
In a fictional example, we surveyed \(5\) students regarding their satisfaction with the cafeteria using \(5\) variables (ratings on a Likert scale from \(1\) very dissatisfied to \(5\) very satisfied). You can see this in the following image:
You can now create \(5\) vectors, each representing a person. Important: We provide a solution under Code, but for your learning progress, it is important that you first try it yourself. After you have succeeded, you can check the solution. Remember: In R, there is always more than one way, so if your approach is different, it does not have to be wrong as long as you get the same result in the end!
First, we need to create five vectors (for the five variables), each containing the values of all individuals. You can perform this step on your own with your current knowledge. Try it yourself first and then check the solution.
auswahl <- c(
  4,
  1,
  3,
  2,
  5
)   # Variable 1
geschmack <- c(
2,
5,
2,
1,
1
) # Variable 2
service <- c(
3,
3,
1,
5,
4
)    # Variable 3
ambiente <- c(
1,
2,
4,
4,
3
)   # Variable 4
preis <- c(
5,
1,
5,
3,
2
)     # Variable 5
Now you have five individual variables, but they still need to be combined into a dataset. We will use the cbind() function for this, where c stands for column: Variables are conventionally placed in the column of a dataset. With this function, we combine the individual vectors into one object:
df <- cbind(
  auswahl,
  geschmack,
  service,
  ambiente,
  preis
)
Now that we have created the new object, if we call it now, it won’t look like the dataset we previously called. This is because vectors of the same length are automatically combined into a matrix:
df## auswahl geschmack service ambiente preis
## [1,] 4 2 3 1 5
## [2,] 1 5 3 2 1
## [3,] 3 2 1 4 5
## [4,] 2 1 5 4 3
## [5,] 5 1 4 3 2We now need to specifically instruct that it is a dataframe and that R should treat the object accordingly. For this, we use the data.frame() function, which converts an object (in the form of a matrix) into the dataframe data type.
df2 <- data.frame(df)

df2
## auswahl geschmack service ambiente preis
## 1 4 2 3 1 5
## 2 1 5 3 2 1
## 3 3 2 1 4 5
## 4 2 1 5 4 3
## 5 5 1 4 3 2The dataset is now ready!
Just like in vector objects, we can extract individual values from the dataset. As before, we do this by using the object name and placing the conditions directly in square brackets [].
Important: There are now two dimensions here - rows and columns. The first argument in the row is the selection of the row, and the second argument is the selection of the column. If you want to know the very first entry, set both arguments to 1.
df2[1, 1] ## [1] 4# 1st Entry: 1st Row, 1st ColumnInstead of individual values, you can also output an entire row or column. You just need to leave the other argument empty:
# dritte Zeile
df2[3, ]
## auswahl geschmack service ambiente preis
## 3 3 2 1 4 5# fünfte Spalte
df2[, 5]## [1] 5 1 5 3 2If you want to display multiple columns or rows at the same time, simply use the familiar function c() within the square brackets.
# Spalte 1, 3 & 4
df2[,
    c(
      1,
      3,
      4
      )
    ]
## auswahl service ambiente
## 1 4 3 1
## 2 1 3 2
## 3 3 1 4
## 4 2 5 4
## 5 5 4 3Alternatively to c(), you can also use a colon :.
# Rows 3 to 5
df2[3:5, ]
## auswahl geschmack service ambiente preis
## 3 3 2 1 4 5
## 4 2 1 5 4 3
## 5 5 1 4 3 2Lastly, you don’t always need to know the position of the variables, instead, you can also use the variable names. However, this only works in combination with the c() function when you want to display multiple columns.
# Spalte auswahl, service und preis
df2[,
    c(
      "auswahl",
      "service",
      "preis"
    )
]
## auswahl service preis
## 1 4 3 5
## 2 1 3 1
## 3 3 1 5
## 4 2 5 3
## 5 5 4 2Now you are well-equipped with the understanding of how datasets are structured! In the next learning block, we will use real and fictional datasets and start manipulating and describing data.
Before you end here, the next chapter will introduce you to gitlab. This is important for group work, as gitlab greatly simplifies collaboration for you!